“Signal”
is one of multi-channel applications designed by me for data acquisition
from a such scientific apparatus,
as pH- meters and so on . This application works in tight conjunction
with the ADC (analog-digital converter ) of scientific
instrument, and gives full range essential methods for data management,
mathematical analysis and presentation.
|
 |
-
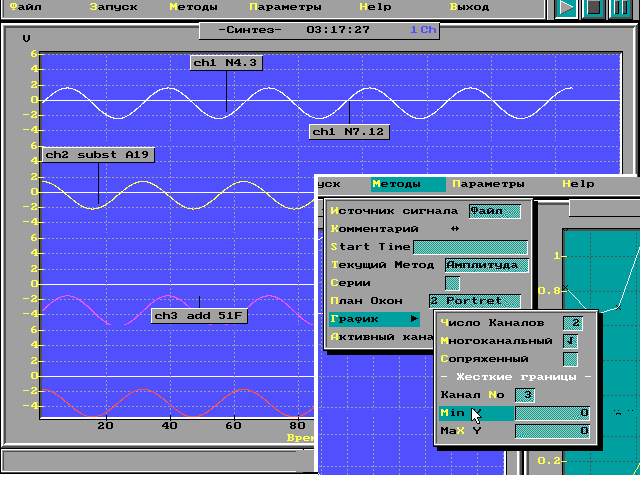
As much as 16 channels can be examined simultaneously.
-
Measured data showing in real time in chart and can be marked for experimental
purposes.
-
Data can be showed as separated channels of chart, as joined in single
chart for mutual comparing.
-
Cascading menu and panels aids fast and easy set up parameters of measurement.
-
Recieved data can be stored in file, exported in Excel, and re-called in
program chart for future analysis.
|
 |
-
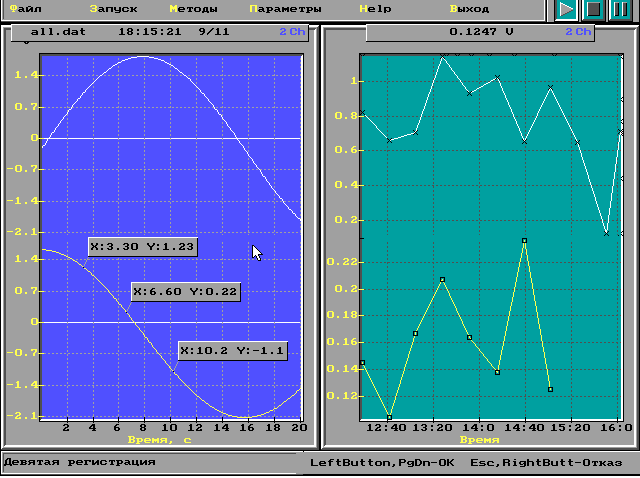
Amplitude, slope or time elapsed between two points can be estimated
interactively by experimentator in procces of data aquisition.
-
Results of measurement appears as charts in right window of screen, and
can be stored in file and called by demand for future analysis.
|
 |
-
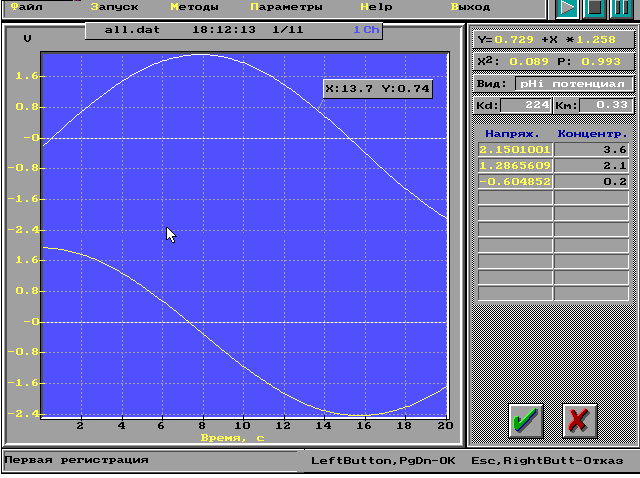
Recieved data can be calibrated, namely, converted from value of volts
to concentration of measured agent, like ion Ca++. Special math apparat
and interface developed for achievement this task.
-
..and much, much more.
There was developed a few application similar by interface,
but far different by methods of data treatment and aimed on achievement
another tasks.
|